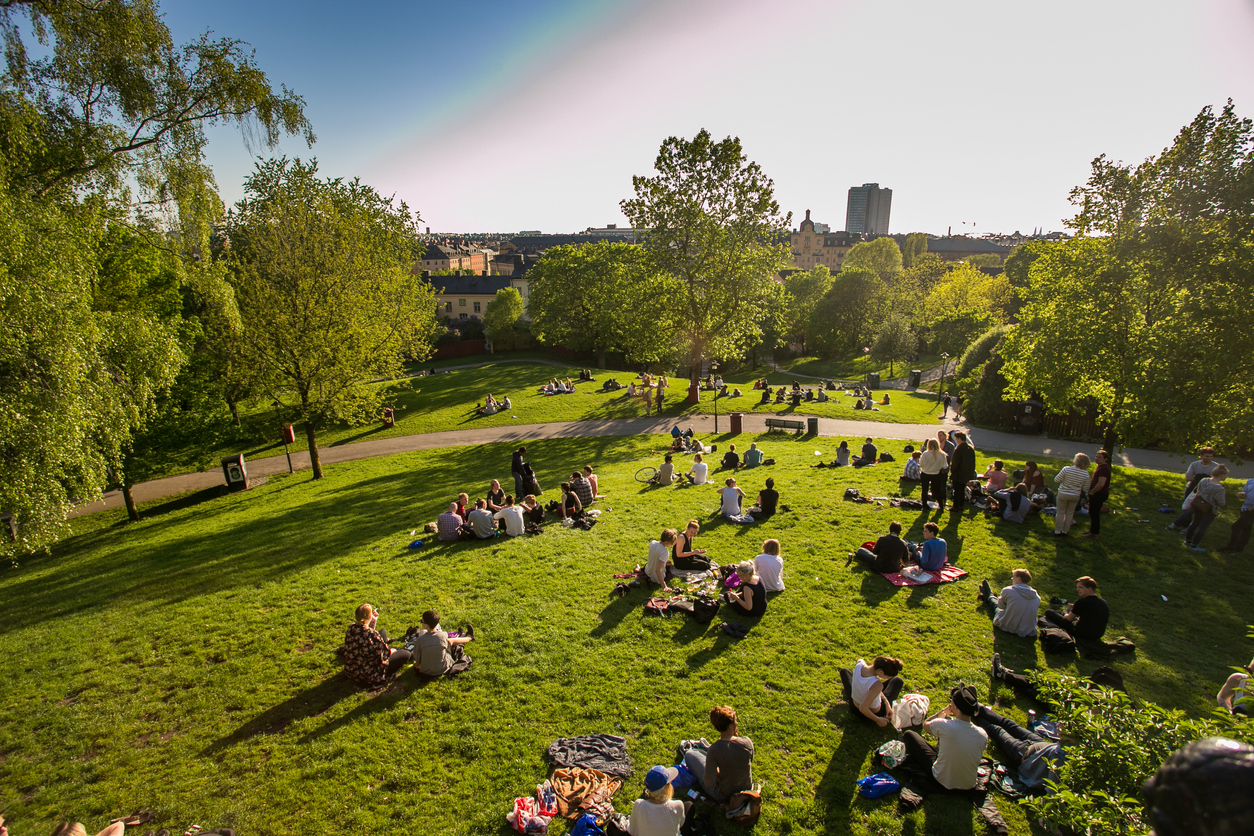
Building visual agro service based on weather and satellite data  I Part 1: Agro Dashboard

Building visual agro service based on weather and satellite data I Part 1: Agro Dashboard

OpenWeather is delighted to offer fast and simple APIs for both weather data and satellite imagery. 

Specifically for agro-users, we have selected a set of APIs that can be incredibly useful for work in the context of agricultural digital solutions development. Additionally, we offer more specialized  APIs as well.

Dive into Agro API  | Part 3 -   Historical NDVI

Dive into Agro API | Part 3 - Historical NDVI

Historical NDVI API is a part of an overall functionality of Agro API, a digital tool created for the needs of agricultural users.

Dashboard update: Current and historical soil data

Dashboard update: Current and historical soil data

The OpenWeather team is pleased to announce that we continue to expand the functionality of our Dashboard.

Dashboard update: Accumulated parameters and weather history

Dashboard update: Accumulated parameters and weather history

The OpenWeather team is pleased to inform you that once again we have significantly expanded the functionality of our Dashboard

Visualisation of the NDVI index on satellite maps. Custom palettes for agricultural applications

Visualisation of the NDVI index on satellite maps. Custom palettes for agricultural applications

For developers of agricultural services or applications, we offer several predefined color palettes.

The second version of our updated Dashboard: Weather data!

The second version of our updated Dashboard: Weather data!

Now you can use our Weather Data function, in addition to those that are already implemented in the Dashboard.

The first version of our updated Dashboard!

The first version of our updated Dashboard!

We are pleased to tell you that we have launched the first version of our updated Dashboard!

Our team is actively developing a new version of the Agricultural Dashboard!

Our team is actively developing a new version of the Agricultural Dashboard!

The main purpose of this significantly advanced version of the Dashboard is to visually demonstrate to you all the data that we provide in our Agricultural API.

OpenWeather 2018: Results of the year: Agricultural, Satellite imagery and Weather API

OpenWeather 2018: Results of the year: Agricultural, Satellite imagery and Weather API

So, the new year 2019 has come and it’s time to sum up the results of the past year for our company, OpenWeatherMap, provider of one of the best weather APIs in the world.

Dashboard for Agricultural Monitoring

Dashboard for Agricultural Monitoring

The Dashboard for Agricultural Monitoring is a service created for visual demonstration of satellite data (NDVI) and weather data (forecast, historical and accumulated parameters), which you can get for your area of interest (that is, for your polygons).