
Building visual agro service based on weather and satellite data | Part 2: Satellite imagery
Posted on 12 Feb 2020
In this series of articles, we are going to look into details on how to create a visual agro service based on satellite images, weather data and our APIs. Please, use Agro Dashboard service as a prototype for your agro service.
This article is describing the ‘Satellite imagery’ page with the following contents:
- Navigation through lists of polygons and available images
- Images in True Colour, NDVI, EVI and False Colour
- NDVI and EVI statistics for each polygon
- Historical NDVI chart
The page is created on the following APIs:
Contents:
Introduction
Getting started
Polygons
The ‘Satellite Imagery’ page
List of polygons and images. True Colour, NDVI, EVI and False Colour images.
NDVI and EVI indices statistics for each polygon
Introduction
Today's agriculture actively uses modern technologies. One of them is based on retrieving and processing satellite data.
Field’s state is assessed by processing satellite data and analysed by vegetation indices, numerical statistics and historical data.
Satellite images, statistics and NDVI historical data could be obtained from OpenWeather APIs: Satellite imagery, Polygons API and History NDVI. Our dataset boasts a huge amount of data collected from the Landsat-8 and Sentinel-2 satellites over several years.
The Satellite imagery, Polygons, History and NDVI APIs are straightforward, simple and accessible services even for beginners. The retrieved data may be easily visualised and integrated into your application.
The full list of APIs and documentation are available here.
Clear representation of API functionality may be assessed in our Dashboard service that could be used as a prototype for your application.
Further details about Dashboard service are described in our blog and AGRO API website.
Getting started
Dashboard service is available at https://agromonitoring.com/dashboard. Follow the link and click ‘Get started’. Use your credentials to login or sign up. Once you logged in, the ‘Satellite imagery’ page will open.
Polygons
Start using the service by defining a polygon - an area of your interest. Polygons could be solid or hollow (having a hole or empty space inside) but should not intersect. The polygon area in the Dashboard should be more than 1 ha and less than 3000 ha.
For more details on how to define a polygon, please see Dashboard documentation and Building visual agro service based on weather and satellite data I Part 1: About Agro Dashboard.
Polygons API is a start point to define a polygon and to get its ID. The API supports requests to update polygons, add new ones and get a list of created polygons.
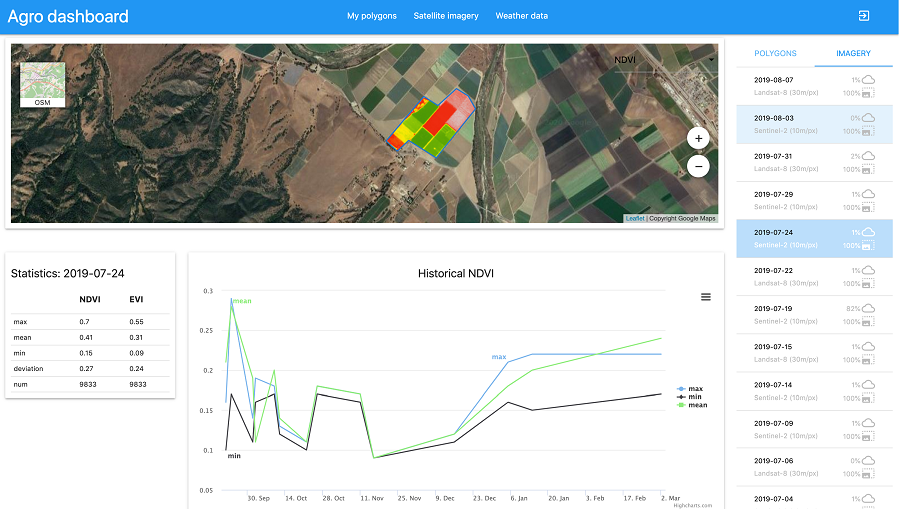
The ‘Satellite Imagery’ page
Picture 1
The ‘Satellite Imagery‘ page consists of several areas:
- Selecting polygons and available images on the right;
- True Colour, NDVI, EVI and False Colour images;
- NDVI and EVI statistics for each polygon;
- Historical NDVI chart.
List of polygons and images. True Colour, NDVI, EVI and False Colour images.
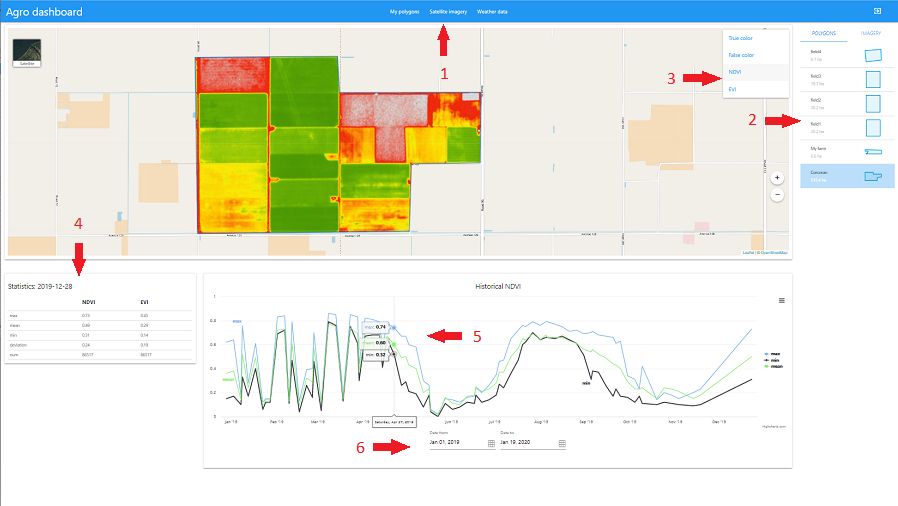
Click on the desired polygon from the list of polygons (Picture 1.arrow 2) to get its details.
List of available images contains True Colour, NDVI, EVI and False Colour images and their characteristics. Select the one from the drop-down list (Picture 1.arrow 3).
Obtaining a list of polygons
Baseline API: Polygons API (see documentation)
Request Method: “GET”
Request template to query Dashboard:
https://wp.agromonitoring.com/dashboard/api/polygons?fields=area,coordinates,bounds,pixels
Polygons API request used by Dashboard:
http://api.agromonitoring.com/agro/1.0/polygons?appid={YOUR_API_KEY}
where API key (appid) is extracted by Dashboard from your logged session
Example of API response:
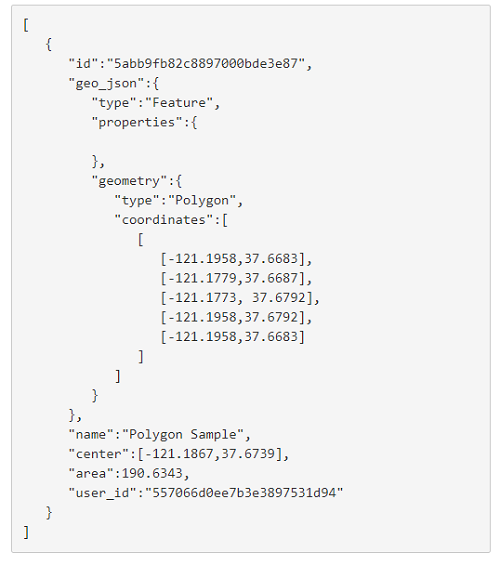
Picture 2
Response parameters are described in the API documentation.
Obtaining satellite images for a polygon
Baseline API: Satellite Imagery (see documentation)
Request Method: “GET”
Satellite Imagery API request used by Dashboard:
http://api.agromonitoring.com/agro/1.0/image/search?start={start}&end={end}&polyid={polyid}&appid={YOUR_API_KEY}
where API key (appid) is extracted by Dashboard from your logged session
The API response provides details about satellite images: acquisition time, image source, percentage of valid data coverage, percentage of cloud cover and satellite position (Picture 3).
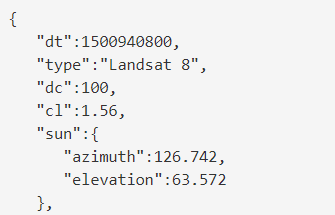
Picture 3
The ‘image’ group (Picture 4) in the response provides a list of URLs to True Colour, False Colour, NDVI and EVI images:
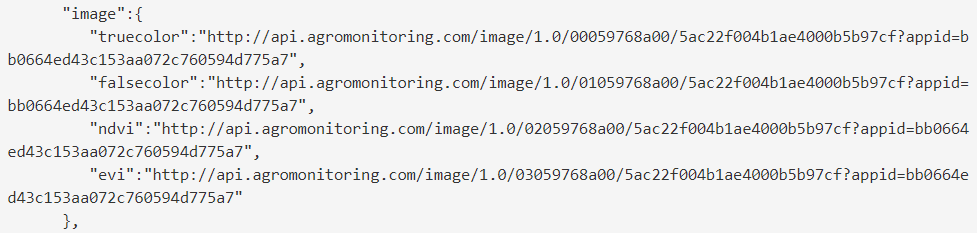
Picture 4
API response details are described in documentation.
NDVI and EVI statistics for each polygon
The following statistics are available for each polygon (Picture 1. arrow 4):
- Max - the maximum value of the index (the third quartile value of the index)
- Mean - the average value of the index
- Min - the minimum value of the index (the first quartile value of the index)
- Deviation - the standard deviation of the index
- Num - the number of pixels for which the index is calculated
Obtaining NDVI and EVI statistics
Baseline API: Satellite Imagery (see documentation)
Request Method: “GET”
NDVI and EVI statistics are provided for polygon tiles and based on the type of satellite and requested date.
Request template to query Dashboard:
https://wp.agromonitoring.com/dashboard/api/ndvi/one?src=s2&date={date}&polyid={polyid}
Obtaining list of satellite images for a polygon.
Satellite Imagery API request used by Dashboard:
http://api.agromonitoring.com/agro/1.0/image/search?start={start}&end={end}&polyid={polyid}&appid={YOUR_API_KEY}
where API key (appid) is extracted by Dashboard from your logged session
The ‘stats’ group (Picture 5) in the response provides a list of URLs to NDVI and EVI statistics:
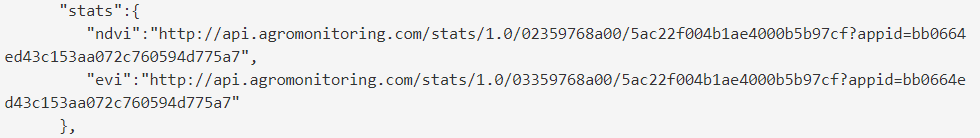
Picture 5
API response details are described in documentation.
Historical NDVI chart
The Historical NDVI chart (Picture 1.arrow 5) is displayed for the selected polygon and contains three curve lines:
- Max - maximum index value
- Mean - average index value
- Min - minimum index value
Use the Date Picker below the chart to choose the date range (Picture 1.arrow 6).
Obtaining NDVI history for a requested date range
Baseline API: History NDVI (see documentation)
Request Method: “GET”
Request template to query Dashboard:
https://wp.agromonitoring.com/dashboard/api/ndvi/all?start={start}&end={end}&polyid={polyid}&fields=mean,p25,p75
where API key (YOUR_API_KEY) is extracted by Dashboard from your logged session
History NDVI API request used by Dashboard:
https://api.agromonitoring.com/agro/1.0/ndvi/history?polyid={polyid}&start={start}&end={end}&appid={YOUR_API_KEY}
Example of API response:
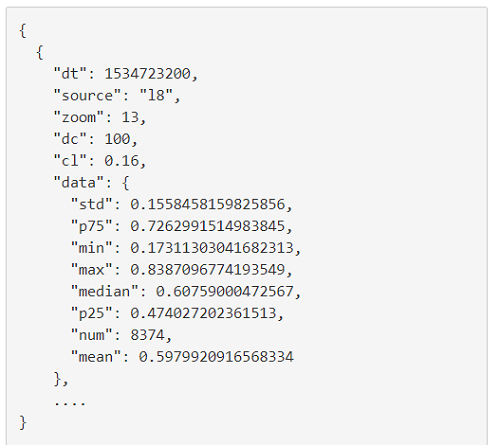
Picture 6
For detailed description of the parameters, please see documentation.
Check our Dashboard documentation to find out how to obtain satellite data for a polygon in the Dashboard.
See also:
Building visual agro service based on weather and satellite data I Part 1: About Agro Dashboard
Your questions and suggestions are always greatly appreciated at info@opernweathermap.org.