
Discover NDVI and its practical uses in agriculture
Posted on 05 Mar 2020
Introduction
In search of more accurate techniques, farmers have been increasingly applying innovative and widely spread technologies over the last few decades. To assist agricultural business OpenWeather has launched several Agro APIs, based on a tremendous range of satellite and weather datasets. In particular, the Satellite Imagery API provides True colour, False colour, EVI and NDVI images.
Here, we are going to overview NDVI – one of the most important and commonly used indicators in precision agriculture.
Quite often we receive questions like what NDVI is, how to use it and why would a farmer require using it at all.
So, what is NDVI? NDVI stands for Normalised Difference Vegetation Index, a common remote sensing measurement, describing the difference between visible and near-infrared reflectance of vegetation cover. The NDVI values range from -1 to 1. Zero and below correspond to non-plant surfaces, thus focusing us solely at values 0-1, which correspond to vegetation areas. The higher the NDVI value the greater plants density and health.
Transforming multispectral NDVI data into a single image layer allows us to estimate the amount of present vegetation and crop development at the field scale. The most common palette for mapping NDVI is white/green, however, it doesn’t give us a full picture of fields condition.
For this reason, we created several contrasting palettes, useful for developers of farming applications.
Collecting NDVI data for your fields
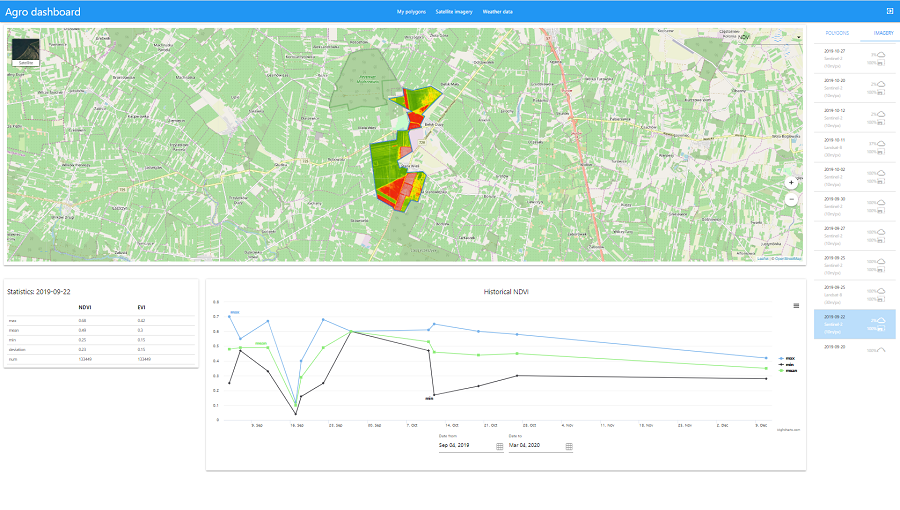
Our newly developed service Agro Dashboard demonstrates the feature of assessing satellite and weather data.
Get started by opening the Dashboard. It will display satellite images corresponding to the coordinates of the fields. Draw a polygon around the fields. Next, click the ‘Satellite imagery’ tab on top of the page and select ‘NDVI’ from the drop-down menu. Choose a date and the least cloudy image from the list on the right side. NDVI chart will be displayed below the satellite image. It’s dynamically built for your polygons based on historical data.
Additional details about the Satellite Imagery are described in Building visual agro service based on weather and satellite data | Part 2: Satellite imagery.
The colour palette below represents NDVI value ranges:
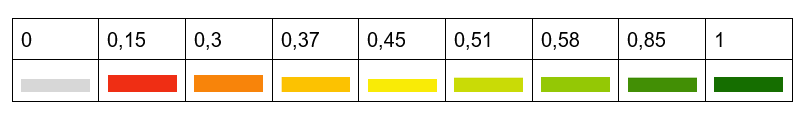
More bright and contrast parts of the NDVI image allow us to estimate the vegetation density. Each phase of plant growth is presented by corresponding colour.
The NDVI palette helps to monitor crop growth and its health, identify potentially diseased parts of your fields and take preventing measures.
Here’s a sample of satellite images taken on 5th-Sept, 2019 representing a few fields with various crops.
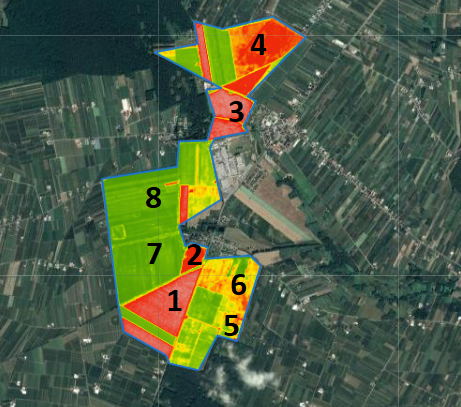
It`s easy to spot that the fields are of different colours.
The fields 1,2,3 (red and grey) and 4 (red and yellow) were sown with winter crops in mid-August 2019. The fields turn redder as crops grow.
As of September 5, fields 1,2,3 are no longer grey. Their colour is solid red, concluding field crops are fine. The colour of the field 4 is scattered red whereas the rest of the field is yellowish. The yellow colour can be explained by a couple of reasons: either the field crops were fast-growing or the weeds overgrew the seedlings.
Let’s take a closer look at the fields 5,6,7,8 as they are presented in multiple colours. The field crops are definitely not winter crops.
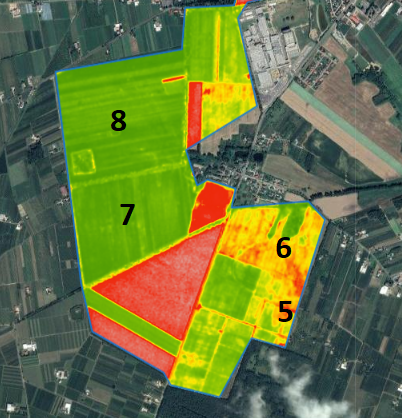
The fields 7 and 8 are solid green. The hardly seen yellow stripes can be explained by sowing method, therefore there’s no concern.
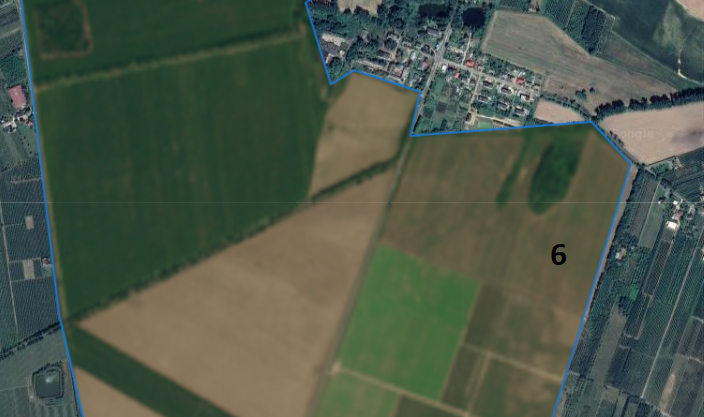
The fields 5 and 6 are multi-coloured. Some parts of the fields have NDVI – 0.15 (the very beginning of vegetation) while others - 0.58 and 0.85. But if we take a closer look at the satellite image of the field 6 in True Colour we will see that the green part is just a part of the woodland.
However, many multi-coloured spots cover field 5. They indicate issues with the crop (red colour) or show weeds overgrowth (green colour). Moreover, green areas in the middle of the field can’t be seen from a road. In this case, it is recommended to visit the field.
Preventive measures may be required following direct observation, e.g., desiccants help to fasten the crop growth, dry the weeds out and make the harvesting easier.
As noted, the NDVI palette not only quantifies green vegetation but also helps to recognise and to mitigate any issues with plant health and vigour, thus, boosting crop yields and making agricultural business more profitable.
See also Visualisation of the NDVI index on satellite maps. Custom palettes for agricultural applications