
Dive into Agro API Part 5 | Accumulated temperature and precipitation by polygon
Posted on 17 Jun 2020
The API to provide accumulated temperature and precipitation is part of the functionality of our APIs for the agricultural sector. Accumulated temperature and precipitation are calculated based on historical weather data, and play a fundamental role in agricultural productivity.
Accumulated temperature is the amount, expressed in degrees, by which the actual air temperature rises or falls above the threshold level during the selected period.
This is an indicator of the beginning of the development of plant crops and the vegetation period of the growing season, and also serves as a signal for the possible reproduction of insects.
All species have a biological minimum temperature below which development does not occur at all. When the ambient temperature begins to exceed this minimum level, it gives rise to growth and reproduction.
Accumulated precipitation is calculated as the sum of daily precipitation during the selected period. Based on this parameter, you can determine whether there is enough moisture for the normal development of crops. For example, the previous dry season can lead to a lack of moisture even in the rainy season, and the harvest will not have enough time to ripen. In this case, additional measures will be required.
How to get accumulated temperature and precipitation by polygon
Step 1. Where to start?
First, you need a personal API key and the identifier of your polygon.
A polygon is an area on the map that specifies the territory for which you need data.
You can find details of how to create, delete and manage polygons here.
Step 2. How to get data? GET request and request parameters
To get the data, you need to make the following GET requests.
Accumulated temperature
API call:
http://api.agromonitoring.com/agro/1.0/weather/history/accumulated_temperature&polyid={ID of polygon}&appid={API key}
Parameters:
appid - personal API key
polyid - ID of polygon
start - start date (unix time, UTC time zone), e.g. start=1517502031
end - end date (unix time, UTC time zone), e.g. end=1519834831
threshold - all values smaller than indicated value are not taken into account, Kelvins
Accumulated precipitation
API call:
http://api.agromonitoring.com/agro/1.0/weather/history/accumulated_precipitation&polyid={ID of polygon}&appid={API key}
Parameters:
appid - Personal API key
polyid - ID of polygon
start - start date (unix time, UTC time zone), e.g. start=1517502031
end - end date (unix time, UTC time zone), e.g. end=1519834831
Step 3. API response: Description of the main parameter
As a result of your request, you will receive a data set for your polygon or the period you specify.
Example of API response для accumulated temperature:
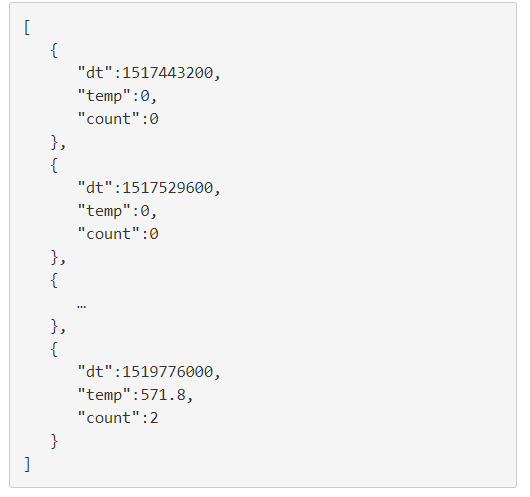
Parameters:
dt - date (unix time, UTC time zone)
temp - Temperature accumulated indicator, Kelvins
count - Number of data measurements
Example of API response для accumulated precipitation:
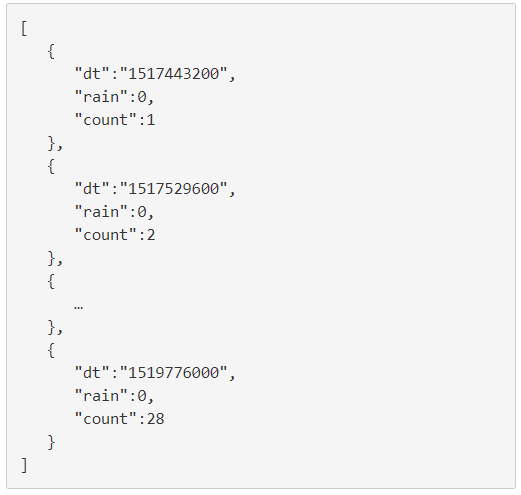
Parameters:
dt - date (unix time, UTC time zone)
rain - precipitation accumulation indicator, mm
count - number of data measurements
Also, see the documentation for accumulated temperature and precipitation.
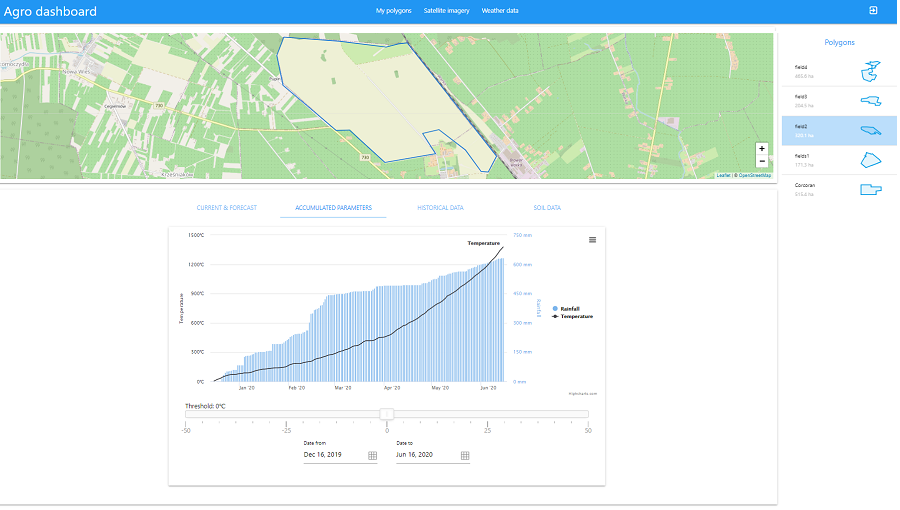
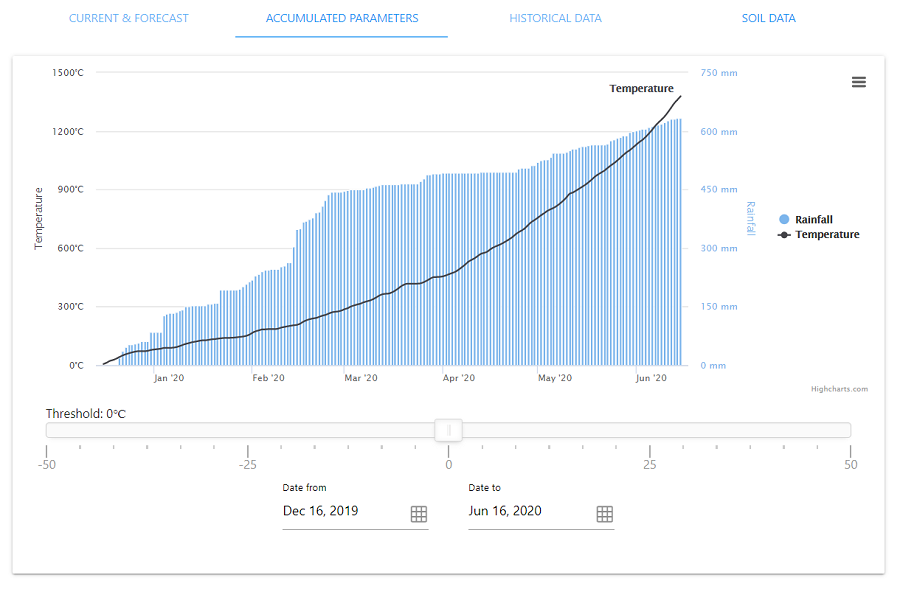
Visual representation of accumulated parameters: Dashboard
Using our Dashboard, you can evaluate what is happening in specific fields.
The graphs allow you to visually track the dynamics of accumulation of temperatures and precipitation for the selected period, and get the values of these parameters on any day in this period.
On the Threshold scale, select the threshold temperature level of interest that is important for your culture in the current situation. The temperature graph will be rebuilt relative to this value, and you can compare it with the value of the accumulated temperature for any day.
By using our data, taking into account the climate of the area where the fields are located and the characteristics of crops growing on them, we can draw conclusions, for example, about the need for additional watering of plants or taking measures against a sharp increase in the number of pests of a particular species.
To find the details of how to get this and other data in a visual form for your fields, please see our documentation for the Dashboard.
We will be happy to answer all your questions, please contact us at info@openweathermap.org