
Dashboard for Agricultural Monitoring
Posted on 17 Oct 2018
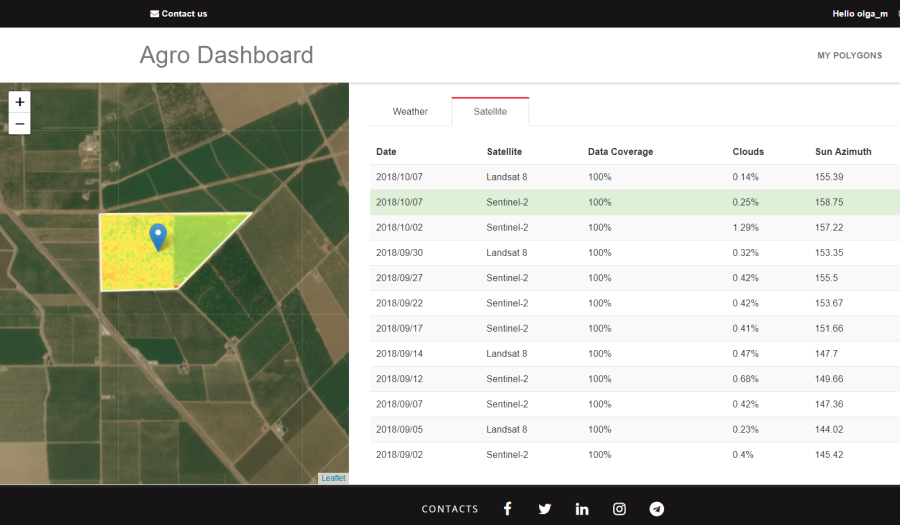
The Dashboard for Agricultural Monitoring is a service created to visually demonstrate satellite data (NDVI) and weather data (forecast, historical and accumulated parameters), which you can get for your area of interest (that is, for your polygons).
The data source for the Dashboard is our Agriculture API. Its main purpose is to display data that you can add to your applications using our Agro API. This is a completely free service, where anyone can easily find weather data, satellite imagery and NDVI for their fields.
We provide an archive of the NDVI index from Landsat 8 and Sentinel-2 for different dates. This functionality allows you to visually assess the NDVI index history for your fields over time.
All you need to do is register on the Dashboard and draw a polygon for your area of interest. If you are already registered for our systems, just use your OpenWeather login and password.
We will continue developing this service, and we are waiting for your questions and comments! You can email us at info@openweathermap.org.