
Building visual agro service based on weather and satellite data I Part 1: Agro Dashboard
Posted on 30 Nov 2019
In this series of articles, we are going to look into details on how to create a visual agro service based on satellite images, weather data and our APIs. Please, use Agro Dashboard service as a prototype for your agro service.
In this article, we will talk about all the great functionality the Agro Dashboard service offers and who may benefit from it. You will also find out about pricing, terms and how to sign up for the service.
About Agro Dashboard
OpenWeather is delighted to offer fast and simple APIs for both weather data and satellite imagery.
These APIs were designed for work with our rich database of weather data, imagery and other relevant agricultural data.
Specifically for agro-users, we have selected a set of APIs that can be incredibly useful for work in the context of agricultural digital solutions development. Additionally, we offer more specialized APIs as well.
In order to visually demonstrate the capabilities of these APIs and their data, we have created the Dashboard.

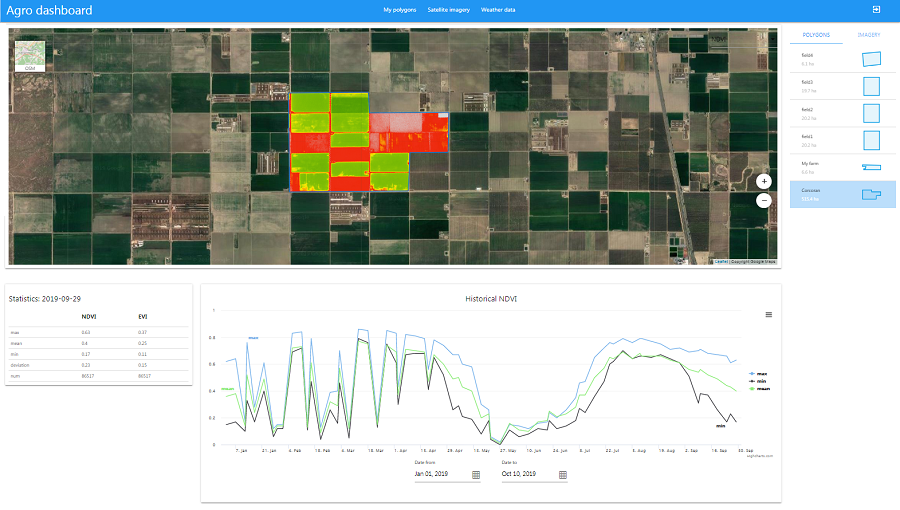
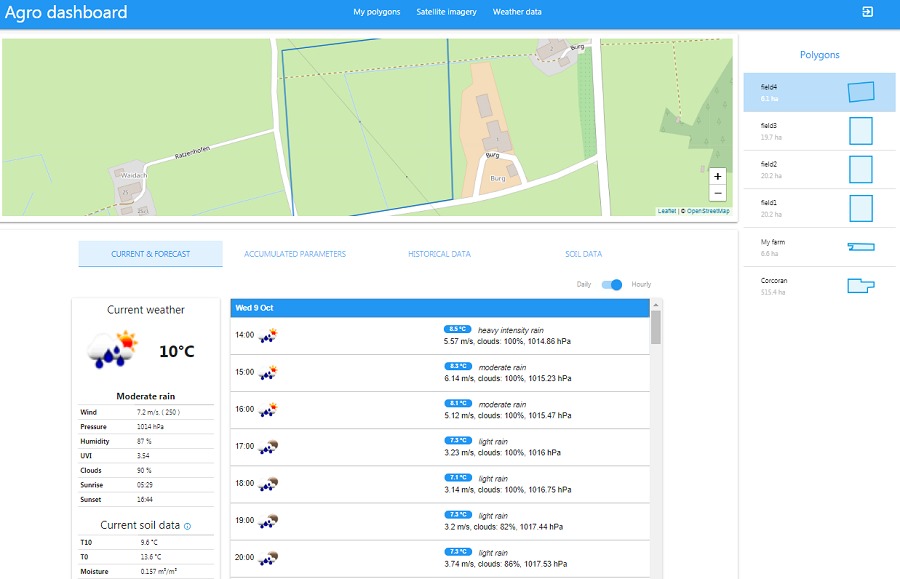
Picture 1
Dashboard for Agricultural Monitoring is a visual service that was created on the basis of our Agricultural APIs for satellite and weather data.
This platform can be used to demonstrate the capabilities of field monitoring, crop growth evaluation and yield prediction with the help of satellite imagery. Additionally, it provides an intuitive representation of accumulated parameters (temperature/humidity) that are essential for efficient agricultural management.
All these data can be received via Agro API and visualised or easily integrated into agricultural applications.
To access the Dashboard, you will need to open the Dashboard page of agromonitoring.com, press 'Start work', complete registration or log in using your details.
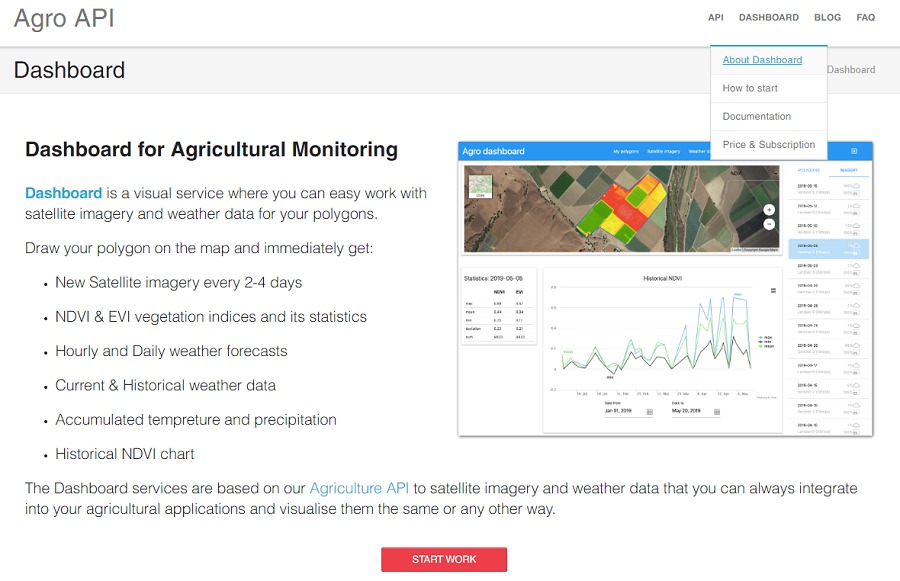
Picture 2
Who are the users of this product?
The Dashboard might be interesting for developers of agricultural applications. The Dashboard makes it easy to get real examples of what we provide through Agricultural API. Developers can use this tool to visually evaluate how APIs work, the quantity and quality of data, the speed of requests processing and the availability of services.
Additionally, this service can be useful to farmers. By offering a visual interface, Dashboard demonstrates the current status of your fields without any programming requirements. Farmers might also be interested in the several years of historical data that are offered both in the form of graphs and tables.
For your convenience, the documentation provides step-by-step instruction.
What Dashboard consists of and how to work with it?
Dashboard consists of 3 main sections: 'My polygons', 'Satellite imagery' and 'Weather data' (see Picture 1).
The starting point is the polygon. Polygons are one (or many) territories that you would like to receive data for. The are of one single polygon can be anything in between 1 ha and 3000 ha. To create a polygon (after you have successfully registered and received your API key), please proceed to ‘My polygons’ section an press 'Create'.
Select the place on the map and simply draw the territory using the instruments provided in the top right corner of the map.
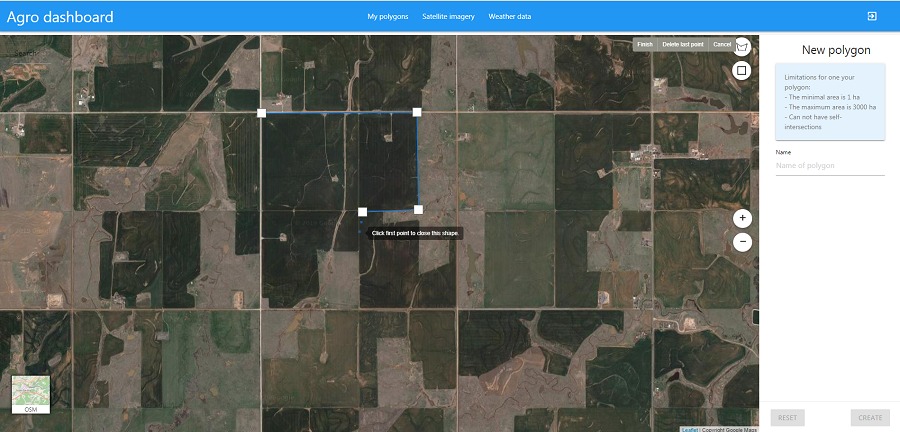
Picture 3
In the future, all your polygons will be accessed via 'My polygons' and you will be able to receive both weather and satellite data for any of them.
'Satellite imagery' section contains:
-True colour, False Colour, NDVI and EVI types of imagery;
-Statistically aggregated data for any of your polygons for all dates with available satellite imagery;
-For each polygon, you can access historical NDVI data for any date or period.
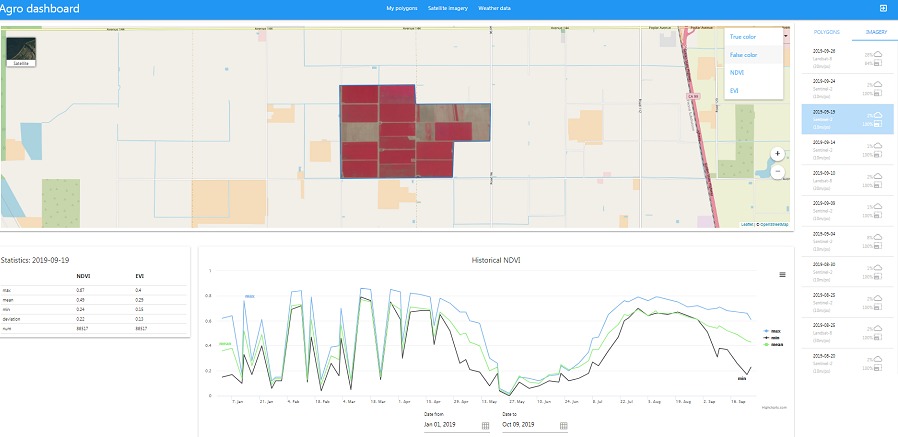
Picture 4
'Weather data' section consists of 4 parts:
-Current & forecast.
Current weather data, soil data (humidity and temperature; on the surface and on the depth of 10 cm), hourly forecast (4 days ahead) and daily forecast (7 days ahead) for each polygon.
Picture 5
- Accumulated temperature and precipitation.
- Historical weather data
- Historical soil data (humidity and temperature; on the surface and on the depth of 10 cm)
Weather data (apart from Current and forecast) can be received both as a graph and as a table for each polygon.
Our subscriptions
In order to receive satellite or weather data, you will need to register. After registration, you will automatically receive access to the functionality of the Free subscription. Should you wish to do it, this will allow you to try out the service. Please note that the number and total area of polygons allowed in the Free subscription are limited. Total area is a sum of areas of all polygons that were created. To learn more about the differences in our subscriptions, please see the Pricing page.
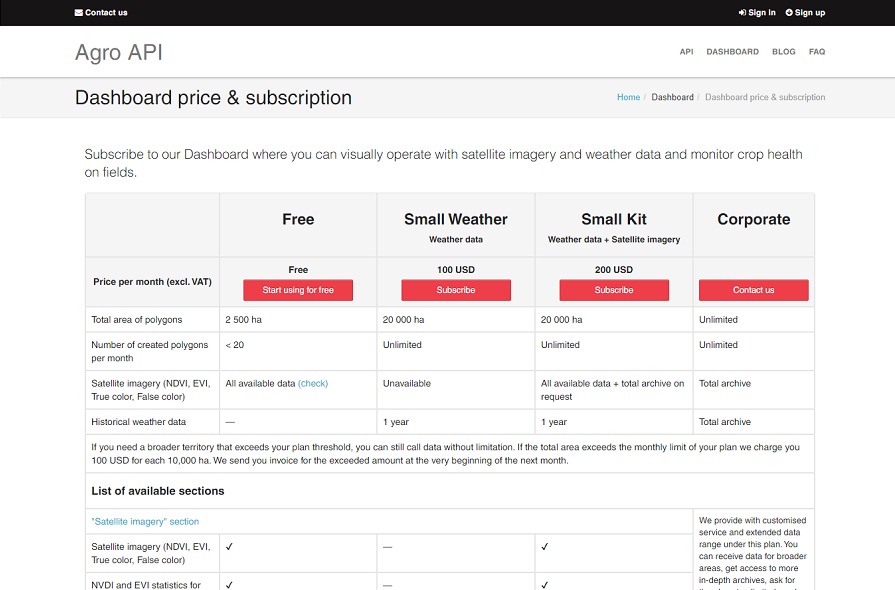
Picture 6
For your convenience, we are offering a flexible system of subscriptions. Users that are only interested in weather data will be particularly interested in the Small Weather subscription. Small Kit subscription includes both weather and satellite imagery. For clients with extensive polygon areas and/or customised requirements, we can offer our Corporate subscription.
If these subscriptions are not suitable to you or you would like to discuss any custom requirements, please feel free to get in touch with us at info@openweathermap.org.
Please also note that, for paid subscriptions, technical limitation on the total area of polygons does not exist. For your convenience, you can create as many polygons as you need and go over your subscription’s monthly limit, if necessary. At the end of the payment period, we will issue an invoice for areas outside of that limit in accordance to our pricing.
Additional information
1. If you have a paid subscription to Agro API, you will already have access to the Dashboard functionality; please note that it varies depending on the subscription.
2. After you create an account with us, you will also receive an API key. There are many functions available that will allow you to manage your subscription, so please find a more detailed description of each tab here. This might become useful if you like to use the Agro API directly, outside the Dashboard service.
See also:
Building visual agro service based on weather and satellite data | Part 2: Satellite imagery
We will be glad to answer your questions, please get in touch with us at info@opernweathermap.org.